There’s a particular graveyard in ecommerce that nobody talks about openly, but every seller with more than one launch under their belt knows intimately. It’s not filled with bad ideas or lazy execution — it’s filled with products that looked completely viable on paper, had reasonable demand data, launched competently, generated decent early sales, and then quietly stopped working somewhere between month two and month four. The traffic dried up, the BSR climbed back toward the hundreds of thousands, and the storage fees became the only thing reliably showing up on the account.
Most of these products didn’t fail because the seller was careless or unskilled. They failed because the product research underneath them was structurally wrong from the start — not wrong in a way that tools would have flagged, but wrong in the way that only becomes visible when you zoom out far enough to see how markets actually behave over time rather than how they look in a single data snapshot.
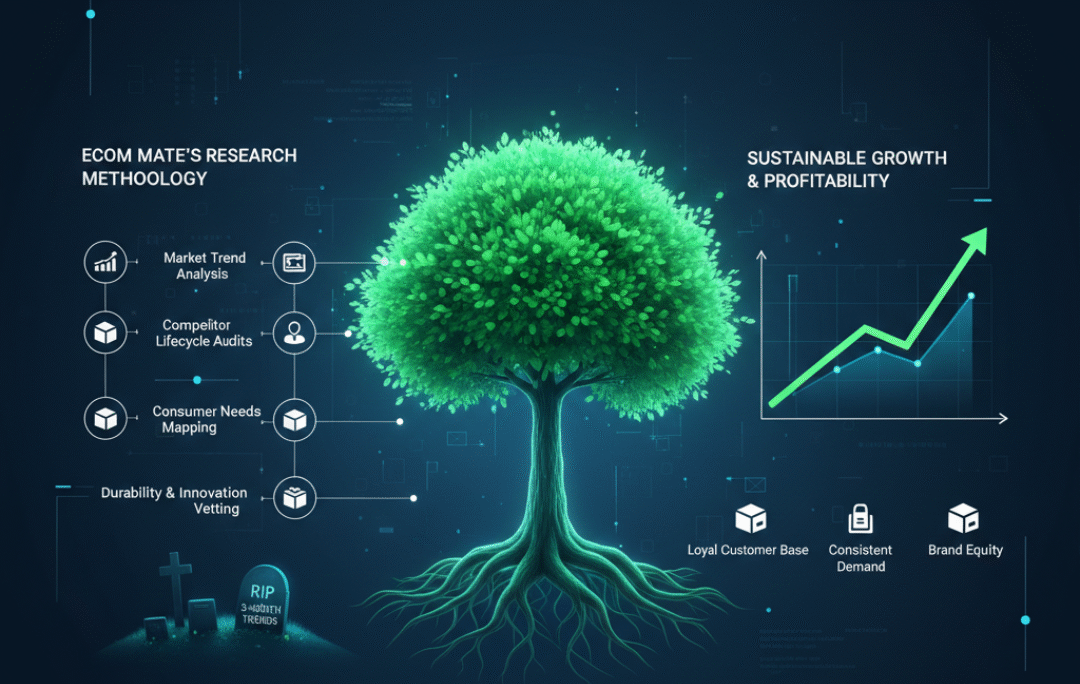
This is our methodology for product research on private label — the specific process we use to evaluate whether a product has the structural characteristics to generate stable revenue for twelve, twenty-four, thirty-six months, not just the first quarter after launch.
The Core Problem to Research Products: Product Research That’s Frozen in Time
The fundamental mistake in most Amazon product research isn’t using the wrong tools or missing a metric — it’s treating a market as if it exists in a single, static moment. The tools that dominate the category — Helium 10, Jungle Scout, and their equivalents — are genuinely excellent at capturing current conditions. What they show you is a snapshot: search volume right now, estimated sales right now, competition density right now. They’re not designed to tell you where this product came from, why it’s selling at this particular volume, whether that volume is the peak of a trend or the middle of a stable long-term demand curve, or what happens when sellers inevitably notice the same metrics you’re looking at.
This matters because the research-to-launch timeline for a private label product typically runs four to eight months from initial research to receiving inventory in an Amazon fulfilment centre. The market condition you’re researching today is not the market condition you’ll be selling into. You’re making a twelve-month bet on a two-second snapshot.
Every element of our research framework is a response to this structural problem. We’re not trying to find products that look good today. We’re trying to find products that will still make commercial sense when competition has increased, when the trend has shifted, when cheaper versions have arrived, and when the market has had time to absorb multiple sellers chasing the same opportunity. If we can’t answer “will this still work in twelve months?” with genuine confidence, the product doesn’t move forward — regardless of how attractive the current numbers look.
Step 1: Hunt for Demand That Doesn’t Need an Audience to Survive
The most reliable long-term products share a characteristic that makes them seem unexciting from a research perspective: they’re needed, not wanted. This distinction sounds abstract until you trace the failure pattern of “exciting” products — the ones that generated genuine enthusiasm in the research phase — and realise how consistently the excitement itself was a warning sign.
Trending products, viral categories, and “just discovered” niches are attractive because the demand data looks dramatic. High search volume, climbing BSR, enthusiastic reviews. What the data doesn’t show is the mechanism: that demand is often driven by a cultural moment — a TikTok trend, a media appearance, a single influencer — rather than by a durable underlying need. When the cultural moment passes, the demand passes with it. Sellers who launched at the peak of the trend find themselves holding inventory in a category that’s moved on.
We deliberately look for the opposite: categories where demand exists independently of any cultural catalyst. Products people buy out of routine, necessity, or habitual replacement — where the purchase decision is made by need rather than by desire. Kitchen tools that solve a specific preparation problem. Pet care items with regular replacement cycles. Health and wellness basics that people reorder without thinking. Cleaning and organisation products with predictable household consumption patterns.
These categories have three properties that make them structurally durable. First, demand is self-sustaining — it doesn’t require external attention to persist. Second, the buyer profile is stable — the same types of people with the same needs are buying year after year. Third, the category attracts rational sellers who are building businesses rather than chasing trends, which means the competitive environment tends to be more stable and predictable than in trending categories.
If a product feels genuinely exciting in the research phase — if the first instinct is “this is going to be huge” — that’s a reason to investigate the mechanism driving the excitement before committing to it. If a product feels dull but consistently useful, that’s usually a signal worth following.
Step 2: Evaluate Demand Over Time, Not Just Current Volume
Current search volume and current sales estimates are the most commonly cited metrics in product research — and by themselves, they’re among the least useful for predicting long-term viability. A product generating 3,000 units of monthly sales could be a stable category workhorse, a seasonal item at its annual peak, or a trend that has been declining for six months and will be down 80% in another three. The number is identical. The underlying situation is completely different.
The tool that most reliably surfaces this difference is Keepa — a BSR (Best Sellers Rank) tracking tool that shows rank history going back years for individual products. Rather than looking at current rank, Keepa lets you trace how rank has moved over time: whether the product maintains a consistent range across seasons, whether there are annual peaks and troughs (indicating seasonal but not trend-dependent demand), and whether the overall trajectory over two-plus years shows stability, growth, or decline.
The pattern we look for is what we call the flat line with predictable variance: a BSR that fluctuates within a reasonably consistent range over 18–24 months, with seasonal movement that’s regular and recoverable rather than sudden and dramatic. A product whose BSR has been between 800 and 4,000 in its main category for two years, with predictable lifts around relevant seasons, is demonstrating the kind of demand durability that gives us confidence a launch today will still be viable in twelve months.
Google Trends provides complementary signal at the category level. Searching the broad category term over a five-year window shows whether the overall category is growing, stable, or declining at the consumer search level — independent of Amazon-specific dynamics. A category with stable or gently growing Google Trends data over five years, rather than a spike followed by decline, confirms that demand is structural rather than event-driven.
The specific threshold we use: we want to see at least 18 months of BSR history showing stable demand with predictable seasonal variance. Products with less than 18 months of history, regardless of how good the current numbers look, are carrying unknown risk — there isn’t enough historical data to distinguish a stable category from a trend that hasn’t finished peaking yet.
Step 3: Distinguish Real Competition from Lazy Competition
The most misread signal in product research is competition density. Most sellers see a category with numerous listings and high review counts and conclude it’s too competitive to enter. This conclusion is often wrong, not because competition doesn’t matter, but because counting listings confuses market presence with competitive strength.
The meaningful distinction is between sellers and brands. A seller is someone who found a product that was selling, ordered it from Alibaba, created a listing, and is generating sales primarily through price competition and keyword matching. A brand is a business with a defined identity, differentiated product presentation, a brand story that creates buyer preference, and a customer relationship that extends beyond the transaction. Most Amazon categories, examined carefully, contain far more sellers than brands — and sellers are not the same competitive threat as brands, because they’re not building anything that creates genuine buyer loyalty.
The audit we run on competitive categories is specifically designed to identify the quality of the competition rather than its quantity. We look at the top ten listings and ask: does this listing have a coherent visual identity that’s consistent across all images? Does the brand name mean anything, or does it appear to be a randomly generated string of letters? Does the A+ Content tell a genuine brand story with original photography, or is it a template with stock images? Are the variations logically structured around genuine buyer needs, or are they colour variants added to inflate perceived selection? Are the reviews discussing the product in ways that suggest a real product experience, or do they read as if they’re describing a category rather than a specific product?
Lazy listings — generic images, boilerplate descriptions, no brand identity, identical packaging to six competitors — are significantly easier to compete against than their review counts suggest. A category where the top ten listings all look the same is a category where genuine differentiation has significant room to create preference. A category where even the third-tier sellers have strong branding, original photography, and brand-specific buyer communities is genuinely more difficult to penetrate, regardless of how the review numbers compare.
We also examine review quality rather than just review quantity. High review counts with a significant proportion of one-star and two-star reviews are signals worth mining. Those negative reviews often describe the exact structural weaknesses that differentiation could address — and they’re written by real customers explaining exactly what they wanted but didn’t get.
Step 4: Find the Structural Weaknesses Before You Think About Improvements
This step is subtle but it’s where our process diverges most significantly from standard product research advice. The conventional approach asks “how can I make this product better?” — identifying improvements that would make your version preferable to existing options. This is the right question for product development, but it’s the wrong starting question for durability analysis.
The starting question should be: “Why does this product exist in this form right now?”
Every weak product — poor packaging, fragile materials, confusing instructions, generic branding — exists in its current form for a reason. Sometimes the reason is supplier limitations (the material that would solve the fragility problem costs too much at the margins most sellers are working with). Sometimes it’s seller shortcuts (professional photography costs money that sellers racing to the lowest price haven’t invested). Sometimes it’s knowledge gaps (the seller who first established category dominance didn’t know what we now know about packaging psychology). Sometimes it’s active cost-cutting decisions made to stay price-competitive.
Understanding the reason behind a weakness is more important than identifying the weakness itself, because it determines whether the weakness is structural or addressable. A weakness that exists because of genuine material cost constraints means addressing it will require pricing above the category average — which changes the competitive math entirely. A weakness that exists because of seller laziness or knowledge gaps means any reasonably competent brand can address it without cost penalty.
The most productive research tool for this analysis is negative review mining. Reading 30–50 one-star and two-star reviews across the top five listings in a category is one of the most information-dense activities in product research. These reviews are written by actual buyers explaining, in their own words, the specific gap between what they expected and what they received. They identify the weaknesses that are actually bothering customers — not the weaknesses that seem obvious from a product development perspective. And they reveal whether those weaknesses are consistently mentioned across multiple sellers (indicating a category-level structural problem that addressing would create genuine differentiation) or isolated to specific listings (indicating individual seller failure rather than category opportunity).
Step 5: Validate Whether Repeat Purchasing Is Possible
This is the filter that eliminates more product ideas than any other single step, and it’s one that most research frameworks don’t include at all.
Products that die after three months frequently share one structural characteristic: they depend entirely on acquiring new customers to generate revenue. There is no mechanism for a satisfied customer to come back. They bought the product, it met their needs, and they never need to buy it or anything related to it again. The business model requires continuously recruiting new buyers, which means continuously spending on advertising, continuously competing for visibility, and continuously generating awareness in a market that gets progressively more saturated.
This is an exhausting and expensive business model that has a natural ceiling: the pool of buyers who haven’t yet purchased the product shrinks over time, while the pool of competitors serving that same pool grows. The combination produces declining margins and rising customer acquisition costs — usually around months three to six, which is precisely when most products show their first serious performance deterioration.
We evaluate three categories of products from a repurchase perspective:
Naturally consumable products are the most structurally durable. Items that are used up — supplements, cleaning products, pet food, skincare, candles — have a built-in repurchase mechanism. A satisfied customer doesn’t need to decide to come back; they’ll come back when they run out. These products have natural lifetime value that makes customer acquisition cost more defensible over time. The challenge is that consumable categories are typically more competitive, because everyone recognises the inherent advantage.
Replacement-cycle products are the second category. Items that wear out through normal use — kitchen utensils, sporting accessories, pet accessories, certain cleaning tools — create natural repurchase triggers even though they’re not consumable. The repurchase timeline is longer (months to years rather than weeks to months), but the mechanism is reliable. These products benefit significantly from brand memory — a customer who had a good experience with your kitchen tool is likely to return to your brand when replacement time comes, provided the brand identity was memorable enough to recognise.
True one-time purchases — items bought once that perform their function indefinitely — require either massive category volume (enough new buyers that the category never becomes saturated) or an expansion path into a product line where the initial purchase creates brand familiarity that drives subsequent purchases of related products. If a product is a genuine one-time purchase with no natural follow-on, it needs to meet a higher bar for category depth and margin durability to justify the investment.
Step 6: Stress-Test Against the Inevitable Copycats
Every product that works will be copied. This isn’t pessimism — it’s how competitive markets function, and it happens faster on Amazon than almost anywhere else. A product generating strong sales at good margins becomes visible to competitor research tools within weeks of launch, and the typical response from category-monitoring sellers is to identify the source supplier and order a functionally identical product within 60–90 days.
The stress test we apply before launch assumes the arrival of five cheaper versions of the product within 12 months and asks: what happens to the business then?
If the honest answer is “we compete primarily on price” — if the only differentiation available is being cheaper than the clone — then the product’s viability after saturation depends on surviving a margin war that progressively benefits whoever has the lowest sourcing costs. This is not a sustainable competitive position for most private label brands, and it’s the mechanism that drives many of the month-three flatlines.
We look for products where genuine competitive moats exist — characteristics that prevent like-for-like replication from being an effective competitive strategy. The strongest moats in Amazon private label are:
Brand trust as a purchase driver. In categories where buyers are making purchases with safety, health, or significant quality implications — supplements, baby products, anything ingested or applied to skin — brand credibility genuinely influences purchase decisions, and a copycat without established reviews and brand history can’t easily purchase the same credibility. The established brand’s review history, seller history, and brand identity create genuine switching resistance.
Proprietary design or formulation. Products where the specific design or formulation creates a measurably differentiated experience — not just aesthetically different but functionally superior in a way that reviewers consistently mention — are harder to copy effectively because replicating the appearance doesn’t replicate the experience. Design patents (which are more accessible than utility patents) add a legal dimension to this moat.
Instructions and education as product components. In categories where correct use of the product is non-obvious and significantly affects the experience, comprehensive guidance — detailed instructions, usage guides, supporting content — creates a component of the purchase that cheap copies can’t easily replicate. Buyers specifically mention “the instructions were excellent” or “the included guide made all the difference” in reviews, which signals that this element is influencing satisfaction and review scores.
Packaging as a trust signal. In gift-oriented categories, premium unboxing categories, or categories where perceived quality at point of first impression significantly influences return rates, packaging quality creates a differentiation that isn’t visible in the listing but affects satisfaction after delivery. Copies that reduce packaging costs to stay price-competitive deliver a worse first impression, which produces worse reviews over time, which creates a quality divergence that grows as both brands accumulate review history.
If a product doesn’t have access to at least one of these moats, we either identify how to engineer one (through formulation, design, educational content, or brand positioning) or we flag the product as price-competition dependent and apply a significantly higher margin threshold to account for the inevitable compression.
Step 7: Map the Expansion Path Before You Commit to the Entry Point
The difference between a product launch and a brand launch is whether there’s a coherent answer to the question “what comes next?” before the first product ships.
Brands that survive and compound beyond month three almost always have a product architecture in mind from the beginning — a logical sequence of products that build on the initial entry point, create cross-selling opportunities, deepen the brand’s category presence, and give returning customers a reason to continue buying from the same brand rather than exploring alternatives. This isn’t about launching multiple products simultaneously. It’s about having a vision for where the brand is going so that the first product is positioned as a starting point rather than a standalone bet.
The specific evaluation we do: for any product passing our other filters, we map at least three logical adjacent products before committing. These could be complementary items (a customer who bought Product A would naturally also benefit from Products B and C), variation strategies (materials, sizes, formats, or formulations serving adjacent buyer needs within the same category), or product line extensions (premium versions, combination packs, or educational additions that build on the same base competency).
If a product has no logical adjacency — if we genuinely cannot identify a coherent next product that would make sense for the same buyer — that’s a signal about the product’s strategic value. It might still be commercially viable as a standalone item, but it requires a higher individual product standard to justify the investment without the compounding benefit of a building product line. Products with clear expansion paths have a structural advantage: each new launch strengthens the brand’s overall position, and the brand’s overall position strengthens the performance of every individual product.
Step 8: The Financial Stress Test — Can the Margin Survive Competitive Pressure?
Most product research frameworks calculate margins at current conditions — current sourcing cost, current listing price, current advertising cost to achieve a target position. This produces a number that looks like a margin but is actually a best-case margin estimate that will deteriorate in every category that performs well.
We model three margin scenarios for every product that passes our other filters:
Current conditions — the margin at today’s market price, today’s advertising cost per unit, and today’s sourcing price for our target order quantity. This is the baseline.
Competitive pressure scenario — what happens to the margin when category average price drops by 15–20% (a predictable consequence of new entrant competition), advertising CPCs rise by 25–30% (a consequence of more sellers bidding on the same keywords), and the minimum viable order quantity increases to compete on shipping economics. If the margin at these conditions doesn’t support a sustainable business, the product was always more fragile than the baseline scenario suggested.
Worst case scenario — the margin floor. What’s the minimum viable price before we’re selling at a loss? What’s the sourcing cost reduction available through volume or supplier negotiation? What’s the maximum sustainable advertising spend per unit? If the worst case scenario means the business isn’t viable, the product shouldn’t launch regardless of how good the baseline looks.
Products that pass all three scenarios — that generate acceptable margin at baseline and remain viable even under competitive pressure and at the margin floor — are structurally more durable than products that only work when conditions are ideal.
Step 9: Apply the Human Logic Sanity Check
After all the tools, all the data, and all the competitive analysis, the final filter is the simplest one: would a normal human being, shopping for something they actually need, buy this product at this price from a brand that looks like this?
This check exists because data-driven research has a specific failure mode: it can validate a product that works on paper but not in practice. Products that exist as spreadsheet hypotheses — that meet every metric threshold but don’t correspond to how real buyers actually make decisions — launch and underperform consistently. The reason is usually that some human element of the purchase decision wasn’t captured by the research: the product feels cheap in a way that photos don’t convey, the use case sounds compelling but most buyers already have something that serves the purpose adequately, the price point puts it in a category where buyers expect brand credibility that a new entrant can’t immediately deliver.
The specific questions we ask at this stage are deliberately non-analytical:
Would we actually buy this at the price we’re targeting? Not “would someone buy this” — would we, knowing what we know about the product’s actual quality and where it sits in the category.
Would we trust this brand with three reviews? Because that’s the situation the first buyers are in, and if the brand identity doesn’t create sufficient trust at launch, the review ramp will be harder and more expensive than the research suggests.
Would we recommend this to someone we actually know? The personal recommendation test is one of the more reliable quality filters available, because it forces you to think about whether the product genuinely delivers on its promise rather than whether it technically meets specification.
Is there any version of this that makes us uncomfortable explaining to a real customer? If there’s an aspect of the product, its sourcing, its quality, or its positioning that we’d prefer not to discuss openly, that discomfort is usually information worth taking seriously.
Why This Process Takes Longer — and Why That’s the Point
Every element of this process extends the research timeline. Analysing 24 months of BSR history takes more time than looking at current sales estimates. Mining 50 negative reviews takes more time than reading the product title and seeing “high demand.” Modelling three margin scenarios takes more time than calculating a single current-conditions margin.
The products we reject are the ones that would have launched, generated initial sales, and then deteriorated in ways that were entirely predictable from the research phase. The time spent in extended research is recovered many times over in avoided launch costs, avoided inventory write-offs, avoided PPC spend on declining products, and avoided opportunity cost of tying capital up in inventory that isn’t moving.
The products we approve are the ones that aren’t just attractive right now — they’re structurally sound. They serve durable demand. They have competitive moats that don’t collapse under price pressure. They exist within a brand architecture that can compound over time. They pass the human logic test that ensures the data corresponds to real buyer behaviour.
Frequently Asked Questions
How long does thorough product research actually take?
For a product that passes our filters and progresses through all stages of evaluation, the research process typically takes four to six weeks. This includes initial category screening, BSR history analysis across multiple products in the category, competitive audit of the top ten listings, supplier landscape evaluation, margin modelling across three scenarios, and expansion path mapping. Rushing this process consistently produces products with unidentified structural weaknesses that become visible only after launch — when they’re significantly more expensive to address.
What BSR range indicates genuinely stable demand?
There’s no universal threshold because BSR is category-relative — a BSR of 5,000 in Kitchen & Dining represents very different sales volume from a BSR of 5,000 in a niche subcategory. What we look for is stability within a range over time rather than the specific number. A product maintaining a BSR between 1,000 and 5,000 in its category for 18 months indicates more durable demand than a product that hit a BSR of 200 six months ago and is now at 3,000 and declining. Keepa’s historical charts make this pattern immediately visible.
Is it possible to find genuinely untapped categories, or has Amazon research become too competitive?
Genuinely untapped categories with meaningful sales volumes are increasingly rare — not because all opportunities have been found, but because the research tools that surface opportunities are available to hundreds of thousands of sellers simultaneously. The more productive frame is not “untapped categories” but “underserved buyers within established categories.” Every substantial category contains buyer segments whose specific needs are not well-served by the existing top sellers. Identifying and specifically serving those segments — through product design, positioning, and brand identity — is a more reliable opportunity than hoping to find a category that other researchers have missed.
How do I know if a product has a defensible moat before I’ve launched it?
Moat analysis before launch is necessarily predictive rather than proven, but there are reliable signals. If existing top sellers in the category don’t have strong brand identities, the moat you’re building (brand trust) is both achievable and more differentiated than the current market. If negative reviews consistently mention a specific quality or design problem that could be addressed through sourcing or design investment, that addressable weakness is a moat in development. If the product requires specific knowledge to use effectively — and existing sellers aren’t providing that knowledge — educational content is a moat that doesn’t require any proprietary sourcing advantage.
What’s the most common mistake sellers make after doing good product research?
Moving to sourcing before validating supplier quality at the target specification. Product research identifies what to sell. Supplier qualification determines whether you can actually sell it at the quality level the research assumed. The most common post-research failure is launching with a supplier who can produce the product but not at the quality standard the competitive positioning requires — which means launching at a quality level that doesn’t match the listing’s implicit promise, generating negative reviews that undermine everything the research identified.
Final Thoughts: Longevity Is Designed Before Launch
Products don’t randomly stop working after three months. They stop working because of decisions made — or not made — in the research phase. The decision to evaluate demand over two years rather than in the current moment. The decision to analyse competitive quality rather than competitive quantity. The decision to model margin scenarios that include competitive pressure rather than only optimal conditions. The decision to ask whether a product’s advantages survive imitation rather than assuming the launch window will last indefinitely.
The research methodology described here is slower, more demanding, and more frequently says no than most sellers are comfortable with. It also produces products that are still generating stable revenue eighteen months after launch — not because the market was kind to them, but because they were built on a foundation that anticipated the ways markets stop being kind.
That’s the actual edge in private label. Not finding products other people haven’t found. Not getting lucky with a launch timing. Building on research thorough enough that the answer to “what happens when this gets harder?” was worked out before the first unit was ordered.
If you want this kind of research done for your brand — not guessed at with tools and optimism, but systematically evaluated against the structural criteria that distinguish durable products from short-lived ones — our Amazon Private Label Services page breaks down exactly how we turn this research process into real, defensible ecommerce brands.