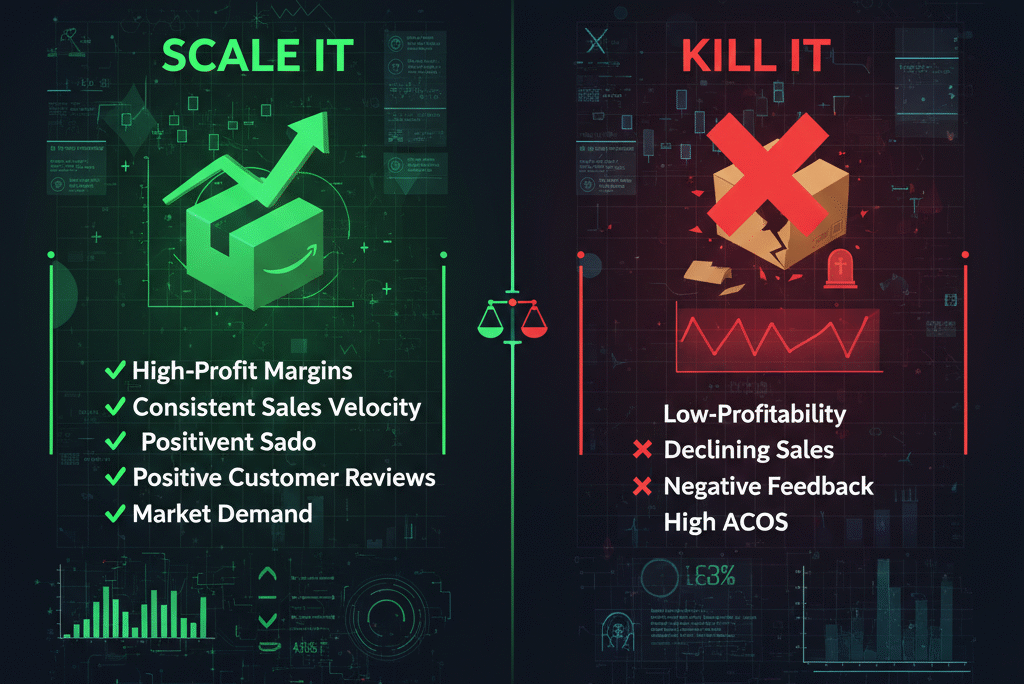
There’s a decision that sits at the centre of every Amazon private label business, gets made repeatedly, and is almost never made with enough data or enough clarity: when to pour more resources into a product that’s showing some promise, or do you accept that it’s not going to work and redirect that capital somewhere better?
Get this wrong in either direction and the consequences are real. Scale too early, before the product has proven itself, and you’re committing working capital to inventory, ad spend, and brand investment that a product without a viable foundation can’t generate returns on. The result is a cash flow problem that can affect your entire business, not just the one product. Hold on too long — which is the more common mistake — and you’re feeding a slow financial leak while better opportunities sit unfunded because you can’t bring yourself to admit that a product you sourced, branded, and launched isn’t going to be what you hoped.
The problem is that Amazon doesn’t provide a verdict. The platform gives you data — a lot of it — but it doesn’t interpret that data for you or tell you what it means for your specific product’s future. That interpretation is where most sellers get it wrong, because they’re reading the signals they want to see rather than the signals that are actually there.
This guide is about reading the signals correctly. Not with emotion, not with optimism bias, and not with the sunk cost thinking that keeps losing products on life support long past the point where a rational decision would have killed them.
The Question Underneath the Question: When to?
Before getting into specific metrics and decision frameworks, there’s a foundational question that needs answering honestly, because all the metrics in the world are just noise if you haven’t answered it.
The question isn’t “is this product selling?” Sales can be manufactured — through discounting, through aggressive advertising, through promotional giveaways, through the artificial velocity that many sellers use to juice rankings at launch. The presence of sales doesn’t tell you whether the product has a viable future. Plenty of products sell acceptably for their first 60–90 days before the launch tactics that were propping them up stop working and reality asserts itself.
The real question is: does this product have inherent market fit at a price that generates acceptable economics?
Market fit means buyers who weren’t pushed to the listing through paid advertising find it, understand it, choose it over alternatives, and don’t regret the purchase. Economics means the margin remaining after all costs — manufacturing, freight, Amazon fees, FBA storage, PPC advertising, returns — is sufficient to justify the capital and operational complexity tied up in the product.
A product with market fit and sound economics at a sustainable price point is a product worth scaling. Everything else is a product that needs to be improved, repositioned, or killed. The diagnostic work of distinguishing between these outcomes is what the rest of this guide covers.
The Metrics That Actually Matter — With Specific Numbers
Generic advice about “watching your conversion rate” and “monitoring PPC performance” isn’t useful without reference points. Here’s what the specific metrics should look like for a product in a scale-ready position versus one that’s struggling.
TACoS: Total Advertising Cost of Sale
TACoS — Total Advertising Cost of Sale — is calculated by dividing your total PPC spend by your total revenue (organic plus paid). It’s the single most useful metric for assessing whether a product is developing organic momentum or remaining artificially dependent on advertising to survive.
The reason TACoS matters more than ACoS (Advertising Cost of Sale, which only measures ad spend against ad-attributed sales) is that ACoS is blind to organic performance. A product can show an improving ACoS while becoming more dependent on advertising overall, if organic sales are declining. TACoS captures the whole picture.
For a private label product at launch, a TACoS of 20–30% is common and acceptable — you’re investing in visibility and ranking, and it’s expected to be expensive relative to overall revenue. Over the following 60–90 days, as the product builds organic ranking and history, TACoS should be declining. A product heading toward scale readiness typically shows a TACoS trending toward 10–15% by the end of a successful launch period.
A product worth scaling in a mature position — three to six months in — should be operating at a TACoS of 8–15% in most categories. If TACoS is above 20% after six months of active optimisation and hasn’t shown a clear declining trend, the product is not developing meaningful organic traction. It’s surviving on advertising, which is not a scalable foundation.
A TACoS consistently above 25% on a product that has been live for several months and properly optimised is one of the clearest kill signals available. Scaling that product means scaling its ad spend dependency — not building a sustainable business.
Organic Sales Percentage
Track what percentage of your total orders are organic (not attributed to a PPC click) on a weekly basis. This number should be increasing over time as the product builds ranking history and the algorithm develops confidence in its relevance for key search terms.
A product that has been live for 90 days with active PPC should have at least 30–40% of its orders coming organically. A product heading toward a scale decision at six months should be generating 50–60%+ organic orders in a typical category, though this varies significantly by category competitiveness.
If organic orders remain below 25–30% after 90 days of active listing — with good images, competitive pricing, and targeted PPC — you likely have a listing quality problem, a competitive positioning problem, or a fundamental market fit problem. Scaling into that situation amplifies the problem; it doesn’t solve it.
Conversion Rate
Amazon’s overall site conversion rate for Prime members averages 10–15%, significantly higher than the 2–4% average for standard e-commerce. Amazon’s own data, referenced in Jungle Scout’s annual seller surveys, suggests that well-performing private label listings in competitive categories typically achieve conversion rates of 8–15% when properly optimised.
A conversion rate below 5% on a product that has been live for 60+ days with at least 10 reviews is a significant concern. Either the listing isn’t communicating the product effectively, the price is out of alignment with perceived value, the reviews are creating doubt, or the traffic being sent by PPC isn’t well-targeted.
The trajectory of conversion rate matters as much as the absolute number. A product that launched at 4% and has grown to 9% over three months is showing positive signals even if the absolute number is below ideal. A product that launched at 7% and has declined to 4% as traffic increased is showing a serious warning sign — more exposure is revealing that the product doesn’t hold up to scrutiny.
Net Margin Per Unit
The margin calculation that matters for scale decisions isn’t gross margin. It’s net margin — what remains after every cost has been deducted: the product’s manufacturing cost, inbound freight per unit (amortised across the shipment), Amazon’s referral fee (typically 8–15% depending on category), FBA fulfilment fee (currently averaging £3–£5 for standard-size products in the UK), FBA storage fees (which can escalate significantly for slow-moving inventory), your blended advertising cost per unit (total PPC spend divided by total units sold), returns allowance (typically 2–5% of units depending on category), and any other variable costs specific to your product.
A product generating a 30% gross margin but a 6% net margin after advertising costs is not a product worth scaling. The advertising dependency is consuming most of the margin, and scaling means either accepting that margin profile at larger volumes or reducing advertising — which, if organic sales are weak, simply reduces total sales.
Private label products worth scaling typically achieve 20–30% net margin on a sustainable basis. Products operating below 15% net margin on a sustained basis need to achieve either a price increase (which requires differentiating justification) or a cost reduction before scaling is financially sensible.
Review Rating and Trajectory
The rating threshold that creates meaningful conversion headwinds in most categories is approximately 3.8 stars. Below that threshold, buyers who encounter the listing are significantly more likely to dismiss it in favour of alternatives with higher ratings, and the review content typically creates sufficient doubt to suppress conversion even when the rating itself is borderline.
A product at 4.2 stars or above with a stable or improving rating trajectory is in a comfortable position for a scale conversation. The reviews aren’t a significant drag on conversion and there’s room for a few negative reviews without catastrophic rating impact.
A product at 3.9 stars with a declining trajectory — where recent reviews are averaging lower than the cumulative score — is a product with an active problem, not a stable one. Scaling that product amplifies the review damage: more sales means more reviews at the declining rate, accelerating the trajectory toward territory where the listing becomes very difficult to convert from.
The Green Lights: Signals That Indicate Scale Readiness
When multiple signals point in the same direction, the decision becomes clearer. Here’s what a genuine scale-ready product looks like in practice.
PPC Efficiency Is Stabilising and Improving
Launch-phase PPC is expensive and should be understood as a ranking investment rather than a margin contribution. The expectation during launch is that you’re paying for visibility while the product builds the ranking history and review base that will eventually allow it to compete organically.
A scale-ready product shows PPC efficiency that is stabilising — not necessarily excellent yet, but no longer deteriorating. ACoS has stopped climbing and is showing a declining trend as keyword bids are refined and match types tightened. Broad match campaigns are providing search term data that can be harvested into more efficient exact and phrase match campaigns. Negative keywords are reducing wasted spend on irrelevant traffic.
The specific pattern that matters: when you reduce PPC spend by 15–20% as a test, total sales don’t decline proportionally. If you reduce ad spend by £200/week and total revenue drops by £200/week worth of sales, your organic presence is effectively zero. If you reduce ad spend by £200/week and total revenue drops by £80/week worth of sales, organic is carrying real weight. The latter is a scale signal. The former is a warning.
Inventory Is Predictably Consumed
A product ready to scale has a sell-through rate that’s consistent enough to plan around. You know, within a reasonable range, how many units will sell per week across seasonal variations, and your lead time from the manufacturer is reliable enough to reorder before stockouts without vastly overstocking.
The specific metric to track is Days of Inventory — how many days of sales your current stock level covers based on recent velocity. A product operating consistently in the 45–75 days of inventory range, with reorders timed to arrive before that drops below 30 days, has a supply chain rhythm that scaling can work within.
Inventory chaos — frequent stockouts, erratic velocity, unpredictable lead times, or chronic overstocking — is a sign the product’s supply chain needs stabilisation before scaling. Running out of stock during scale is particularly damaging because it destroys ranking that took months to build and is expensive and time-consuming to rebuild.
Customer Feedback Is Manageable in Category
Not all negative reviews indicate a product problem. Some categories naturally attract pickier reviewers. Some products attract a disproportionate volume of negative reviews from buyers with unrealistic expectations, poor comprehension of the listing description, or a threshold for acceptable quality that the price doesn’t justify.
What matters is whether the negative feedback identifies fixable issues or structural product problems. Negative reviews about damaged packaging in transit, missing instructions, confusing assembly, or minor cosmetic variations are fixable. Negative reviews consistently identifying that the product doesn’t work as described, that it fails quickly, or that the materials are clearly inferior to the product listing’s implied quality are structural — and scaling means generating more of those reviews, faster, which compounds the problem rather than resolving it.
Read your one and two-star reviews as a group, not individually. Look for patterns rather than outliers. If the complaints cluster around a specific, addressable issue, that’s improvement territory. If they cluster around fundamental product concerns, that’s kill territory.
The Unit Economics Work Without Heroic Assumptions
The margin model for a scaled version of the product should be built conservatively — what do the economics look like if advertising costs increase by 20%, if the supplier raises prices by 10%, if Amazon adjusts the category referral fee, or if a new competitor enters and applies price pressure that forces a 15% price reduction? A product that survives those scenarios with acceptable margins is a genuinely scalable product. A product that requires everything to go right to stay marginally profitable is not.
The Red Flags: When Killing the Product Is the Right Call
Killing a product is a genuine strategic decision, not a failure. The sellers who build sustainable Amazon businesses kill more products than they scale — because they identify the ones that aren’t going to work before they’ve committed the capital that scaling requires.
PPC Never Stabilises Despite Correct Optimisation
There’s a category of Amazon PPC problem that optimisation cannot fix: a product that has a fundamental relevance or appeal problem that results in low CTR from search results and low conversion from the listing, regardless of how the campaigns are structured. In this situation, every optimisation reduces wasted spend in one area while exposing more waste in another — because the core problem isn’t the campaign structure, it’s that buyers see the product in search results, don’t find it compelling, or arrive at the listing and don’t convert.
A product that has had 90+ days of active, competent PPC management and still shows a TACoS above 25% without clear declining trend should trigger a serious kill assessment. Before making the call, exhaust the obvious explanations: has the main image been tested against alternatives? Has pricing been tested across a range? Has A+ Content been added if eligible? Has the listing been audited for keyword relevance? If the answer to all of these is yes and performance hasn’t moved, the market is telling you something. The product as currently positioned doesn’t resonate with buyers at a price that works economically.
Review Problems Are Structural, Not Cosmetic
The distinction between fixable and structural review problems is critical, because they require opposite responses.
Fixable review problems are about execution: the packaging arrived damaged, the instructions were unclear, the colour in the photos looked different from the actual product. These can be addressed through supplier communication, packaging improvements, and listing updates. If you fix the specific problem the reviews identify and the subsequent reviews stop mentioning it, you’ve solved it.
Structural review problems are about the product itself: it doesn’t work as described, it’s lower quality than the price justifies, it breaks quickly under normal use, or it doesn’t deliver the core benefit the listing promises. These cannot be fixed by adjusting the listing or improving packaging. The product needs to be redesigned or the category needs to be exited.
The kill signal is when reviews identify structural problems that you cannot address without essentially developing a different product. If the complaints about your kitchen gadget are that it doesn’t actually do the thing it’s supposed to do effectively, no amount of better photography or stronger PPC structure solves that. The product will continue generating those reviews as long as it’s sold, and the cumulative rating will continue declining until conversion collapses.
Margins Are Structurally Insufficient and Improving Competition Is Making It Worse
Competitive dynamics on Amazon move quickly. A category that had three or four well-reviewed private label options when you launched can have fifteen within 18 months as new sellers identify the demand signal and enter. That competition has specific financial effects: it puts downward pressure on prices, it raises advertising costs as more sellers bid on the same keywords, and it makes it harder for a product without differentiation to maintain its position.
A product that was marginally viable economically at launch often becomes unviable as category competition increases — because the margin compression from price pressure and rising PPC costs removes the thin buffer that kept it profitable. The right response to this trajectory, when it’s identified early, is to either differentiate the product in a way that justifies premium pricing or exit before the capital situation deteriorates further.
The pattern that signals a kill decision: margins that are declining quarter over quarter despite optimisation efforts, combined with increasing competition in the category and no clear differentiation strategy that would reverse the trend. If you can’t identify a specific change that would materially improve the economics within a realistic timeframe, the longer you stay, the more capital you consume.
The Product Requires Constant Intervention to Maintain Baseline Performance
A scalable product eventually requires decreasing attention per unit of revenue as systems and processes are established. A product that requires constant manual intervention — daily bid adjustments to prevent performance collapse, frequent listing edits, regular supplier quality crises, recurring customer service issues — is expensive to operate at small scale and impossible to scale without a proportional increase in operational complexity.
If you find yourself spending disproportionate time on a specific product relative to the revenue it generates, that’s a signal worth interrogating. Some products are genuinely worth intensive management because the revenue and margin justify it. Others become time sinks that prevent the operational capacity required to launch and develop better products. The opportunity cost of time is real, even if it doesn’t appear in your Amazon seller account metrics.
The Middle Path: Improvement Before a Decision
Not every product presenting concerning signals deserves immediate termination. Some products are one or two variables away from a genuinely different outcome, and making the improvement-versus-kill decision before testing those variables is premature.
The discipline here is to test one significant variable at a time, with enough traffic to generate statistically meaningful data, before drawing conclusions. Changing images, copy, and pricing simultaneously makes it impossible to identify which change affected performance. Making changes with insufficient traffic means noise drowns the signal.
What to Improve First
If conversion rate is the primary concern, start with the main listing image. In most categories, the main image accounts for the largest share of CTR from search results, which affects the traffic quality entering the listing. Amazon’s Manage Your Experiments tool allows A/B testing of main images for brand-registered sellers, generating statistically controlled comparison data. Run an image test for a minimum of two weeks with sufficient traffic volume before drawing conclusions.
If the main image performs comparably to the alternative, move to the secondary images and A+ Content, which affect on-page conversion. Amazon’s own data on A+ Content consistently indicates a 3–10% average conversion rate improvement for listings that add high-quality A+ modules over baseline listings. For a product with a conversion rate problem, this is often the highest-return improvement available.
If the listing quality is genuinely strong and conversion remains poor, the issue is likely product-market fit rather than presentation. At that point, assess whether a meaningful price reduction would unlock a different segment of buyers — sometimes a product is correctly positioned but incorrectly priced for the demand that exists at that price point.
How Long to Give Improvements to Show Results
The timeline for evaluating whether an improvement has worked depends on the traffic volume the listing receives. A product generating 50 visits per day needs at minimum 30 days to accumulate meaningful post-change data. A product generating 200+ visits per day can show directional results within 10–14 days.
The pattern that indicates improvement is working: conversion rate and TACoS both improving in the weeks following the change, without a confounding variable (a price reduction or a significant PPC change) that might explain the improvement. If conversion improves but you simultaneously reduced price, the improvement might be entirely price-driven — which has margin implications that need to be evaluated separately.
If the improvement shows no meaningful movement after adequate time and traffic, the variable you changed wasn’t the problem. Move to the next most significant variable rather than making further adjustments to the same element.
How to Scale Correctly When the Signals Align
When the signals genuinely align — declining TACoS, growing organic sales percentage, stable review trajectory, healthy conversion, and unit economics that work without optimistic assumptions — scaling should be methodical rather than aggressive.
Inventory Scaling
The most dangerous mistake in scaling inventory is placing a dramatically larger order based on current velocity without accounting for the velocity increase that scale will generate. Equally dangerous is placing a large order and watching velocity underperform expectations, trapping capital in slow-moving FBA inventory where storage fees compound.
A disciplined approach to inventory scaling increases order quantities by 40–60% at a time rather than doubling or tripling in a single step. This provides meaningful inventory depth to support scaling without catastrophic consequences if velocity doesn’t match projections. If the first scaled order sells through in line with projections, the subsequent order can increase by a similar proportion with more confidence.
Amazon’s Inventory Performance Index (IPI score) measures how efficiently you’re managing FBA inventory. Maintaining an IPI above 400 — and ideally above 500 — avoids storage limit restrictions that can prevent you from sending scaled inventory quantities when you need to. Monitoring this score becomes more important as inventory volume increases.
Advertising Scaling
Advertising budget should scale proportionally with inventory investment, not ahead of it. A common mistake is increasing ad spend significantly to drive velocity before the inventory depth to sustain that velocity is in place — generating a stockout when the scaled advertising produces the volume it was designed to generate.
Scale advertising in increments: increase daily budgets by 20–30% and allow the campaigns two weeks to stabilise before the next increase. During each increment, monitor TACoS closely. If TACoS holds steady or continues declining as spend increases, the additional spend is generating efficiency — more organic traction is supporting the scaled paid investment. If TACoS increases as spend increases, the marginal ad spend is less efficient than baseline and you’re approaching the point of diminishing returns.
Expand keyword coverage during scaling using the search term data accumulated during the launch and optimisation period. The search terms that have demonstrated both impression volume and conversion rate in your existing campaigns are the safest targets for expanded investment. New keyword territory should be explored with broad match campaigns and small budgets rather than large exact match investments in unvalidated terms.
Brand and Listing Investment
Scaling is also the right moment to invest in the brand and listing elements that create durable competitive positioning. A+ Content if you haven’t already added it. Video content for the listing, which consistently outperforms static secondary images for engagement on mobile. Brand Store development that creates a destination for repeat buyers. Trademark registration if you haven’t initiated it, which unlocks Brand Registry features including A+ Content, Sponsored Brands video ads, and enhanced brand protection.
These investments compound over time — they make the listing more defensible against new competitors, they improve conversion in ways that reduce advertising dependency, and they make the brand more valuable as an asset if you’re building toward an eventual exit.
The Operational Reality of Killing a Product
Killing a product is a business decision, not an emotional one, and like any business decision it should be executed with a plan rather than abandoned in frustration.
Liquidation Options for Existing Inventory
When you’ve made the decision to exit a product, you have several options for the remaining FBA inventory. The economics of each depend on how much inventory remains and how quickly you need the capital.
Running a deep promotion or Lightning Deal can clear inventory relatively quickly at reduced margin — sometimes near or below cost, but recovering some cash rather than paying ongoing storage fees on inventory you’re not committed to restocking. For inventory that’s genuinely difficult to sell at any reasonable price, Amazon’s FBA Liquidations programme sells inventory to liquidation buyers at a small recovery rate rather than charging you removal and disposal fees. For inventory that’s completely unrecoverable through normal sale, removal and disposal is the final option.
The calculation is: what is the storage fee cost of holding the inventory while it slowly sells at reduced prices, versus the immediate recovery from liquidation or removal? For large volumes of slow-moving inventory, liquidation or removal is often better than paying long-term storage fees while the inventory trickles out.
What a Killed Product Actually Teaches You
Every product that doesn’t work generates specific, actionable intelligence about your sourcing, your market selection process, your launch execution, or your listing quality — if you review it honestly rather than rationalising what went wrong.
Products that fail due to poor market research teach you what demand validation actually looks like versus what it appeared to be. Products that fail due to quality issues teach you what due diligence in supplier selection and pre-shipment inspection should have caught. Products that fail due to listing quality teach you what level of photography, copy, and A+ investment is necessary before launch. Products that fail due to competitive dynamics teach you how to read category competition trajectories more accurately.
The most expensive way to learn these lessons is to drag a failed product along for 18 months before accepting the decision. The capital and time consumed in that extended denial phase could have funded research and launch of a product with better fundamentals.
Frequently Asked Questions
How long should I give a new product before making a scale or kill decision?
The minimum evaluation period for most products in most categories is 90 days from the point of having sufficient reviews to compete meaningfully (typically 15–25 reviews). Before that threshold, the listing is operating in launch conditions that aren’t representative of its mature performance. The full evaluation period for a deliberate scale or kill decision is typically 120–180 days of active management, which provides enough history to distinguish genuine trends from early variance. Products in very competitive categories with high traffic may show clearer signals faster; products in lower-traffic categories need the longer end of this range.
My TACoS is high but revenue is growing. Isn’t that a good sign?
Revenue growth is a positive signal, but it needs context. Revenue growing because you’re increasing ad spend, and TACoS remaining high or increasing as a result, suggests that growth is entirely ad-driven. That’s expensive growth that doesn’t build a sustainable business — it builds a revenue line that collapses if ad spend decreases. The test is: does organic revenue grow as total revenue grows? If organic sales are increasing alongside total revenue, the ad spend is generating genuine traction. If organic sales are flat while paid sales grow, you’re buying revenue rather than building it.
Can a product with a 3.7-star rating be saved?
Occasionally, but it requires addressing the specific causes of negative reviews before the accumulated rating can recover — and recovery is slow, because new positive reviews are averaged against the existing low-rating base. A product at 3.7 stars that has a clear, fixable problem (packaging, instructions, a specific feature) can recover with a product improvement and a sustained period of new positive reviews. A product at 3.7 stars due to fundamental quality or performance issues is extremely difficult to recover because the underlying issue will continue generating low ratings regardless of other improvements. For context: getting from 3.7 to 4.2 stars with 100 existing reviews requires approximately 65 consecutive 5-star reviews — which is a slow and expensive process.
What’s the difference between a product that needs improvement and one that needs to be killed?
The distinction is whether the problems are fixable within the economics of the product. A product with weak listing presentation that converts well when buyers can evaluate it in detail has a fixable problem — better images and A+ Content are a finite investment that should resolve it. A product with a core quality or performance problem that the market rejects regardless of how it’s presented has an unfixable problem — at least without effectively developing a different product. The test is: if you resolved the specific thing the negative reviews identify, would the economics work? If yes, improve it. If the resolution requires redesigning the product or exiting the category, kill it.
How do I know if I’m holding on to a product out of sunk cost bias?
Ask yourself: if this product wasn’t in my portfolio yet and someone offered me the opportunity to launch it today, with everything you now know about its performance, margins, and competitive position — would you launch it? If the honest answer is no, you’re probably holding on because of what you’ve already invested rather than what the product is worth going forward. Sunk cost bias is almost universal — the solution is forcing yourself to evaluate the product forward-looking rather than backward-looking. The money already spent doesn’t change what the product will generate in the future.
When is the right time to start scaling advertising budget specifically?
Scale advertising budget when organic sales percentage is growing (not just organic sales in absolute terms), when TACoS has stabilised at or below 15%, and when the listing quality — images, A+ Content, review count, and rating — is genuinely competitive for the category. Scaling ad spend before listing quality is competitive means you’re paying to drive traffic to a listing that converts below the category standard, which is expensive and builds poor performance data into the listing’s quality score. Invest in listing quality before investing heavily in traffic.
Final Thoughts On When to Scale an Amazon Product
The decision to scale or kill an Amazon product isn’t a single moment — it’s a conclusion you reach through a disciplined process of tracking the right metrics, being honest about what they indicate, and resisting the emotional pull toward both overconfidence (scaling too early) and persistence (holding on too long).
The sellers who build genuinely valuable Amazon businesses share a specific characteristic: they make these decisions based on data rather than hope, and they make them earlier than their emotional instincts suggest. They scale the products that have earned it and kill the ones that haven’t, cleanly and without sentimentality, redirecting the capital into the next research cycle with the lessons of the failed product clearly in mind.
Products are experiments. Some prove their hypothesis and deserve investment. Others disprove it and deserve a clean exit. Neither outcome is failure — the failure is refusing to read the result.
To make smarter decisions at the keyword and campaign level — understanding which search terms are actually driving profitable sales versus which are generating volume without returns — the SQP-STR Combo Analyzer connects search query performance data with real sales outcomes, giving you the product-level intelligence that gut feel can’t provide.
For broader support across the full private label process — from product research and launch strategy to scaling decisions and brand development — explore our Amazon Private Label Services to see how we work with sellers at every stage of building a brand worth scaling.
For Amazon’s own perspective on listing optimisation and marketplace strategy, the Amazon Selling Partner Blog covers platform updates and seller guidance directly from the source.